Torque vs Speed Characteristics of Stepper Motor
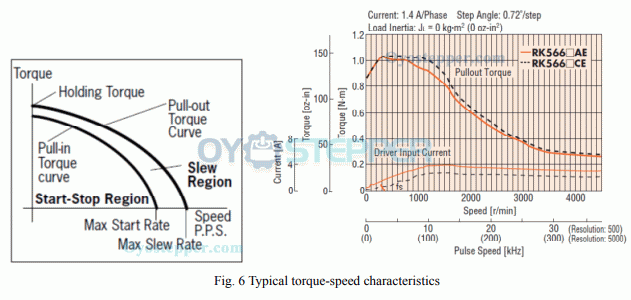
A speed torque graph describes how available output torque changes as motor shaft speed changes while a stepper motor is driven. The horizontal axis represents shaft speed, and the vertical axis represents torque. Curves on the graph vary with motor design, current setting, excitation or microstepping mode, driver type, supply voltage, and test conditions.
1) Holding torque (rated current, zero speed)
Holding torque is the torque present at the motor shaft when rated current is applied and the shaft is not rotating. It is a static value measured at zero speed. If a gearbox is used, the usable torque at the output is limited by the mechanical rating of the gearbox components.
2) Pull-in curve (start/stop region boundary)
The pull-in curve marks the boundary of the start/stop region. Within this region, the motor can start from rest or stop to rest at the commanded step rate under the stated load condition without a speed ramp. Outside this region, a speed ramp is typically used to reduce the risk of losing step synchronization.
3) Pull-out torque curve (running boundary at speed)
The pull-out torque curve indicates the load-torque boundary the motor can sustain while running at a given speed under stated drive conditions. If the required running torque exceeds this boundary at an operating speed, the motor can lose synchronism in an open-loop system.
4) Starting frequency limit (no ramp, stated load condition)
Starting frequency limit is the step pulse rate boundary at which the motor can start or stop without an acceleration or deceleration profile under a stated condition. When external friction load and inertial load are reduced, this boundary shifts. As inertial load increases, the start/stop boundary shifts to a lower pulse rate.
5) Slew-rate limit (no-load operating boundary)
Slew-rate limit is the step pulse rate boundary observed under a stated no-load condition. This boundary depends on driver method, supply voltage, winding inductance, and excitation mode. No-load conditions do not represent limits under applied load.
Documentation notes
Curve values are read together with the stated test conditions, including driver type, supply voltage, current setting, excitation mode, and measurement method.
System torque and speed boundaries depend on load inertia, friction, transmission ratio, and the motion profile used by the controller.
Source:https://www.oyostepper.com/article-1110-Torque-vs-Speed-Characteristics-of-Stepper-Motor.html